
Anticoagulation for Emergent ECMO Cannulation
Anticoagulation for Emergent ECMO Cannulation
| Agent | Bolus | Infusion | Target |
|---|---|---|---|
| Heparin | 50–100 U/kg | weight-based drip | ACT 180–220 / PTT 50–75 / anti-Xa 0.3–0.7 |
| Bivalirudin | 0.5 mg/kg | 0.15–0.3 mg/kg/h | aPTT 50–80 / ACT 160–220 |
| Argatroban | none | 0.3–0.5 mcg/kg/min | aPTT 50–80 / ACT 180–220 |
- Bivalirudin first — only agent that reduces device thrombosis
- Argatroban fallback — does not reduce circuit thrombosis
- Neither available, cannot defer? One-time heparin ~2,500 U for circuit init only → transition to DTI immediately
The Decision Tree
Standard case (no HIT, no contraindication)
UFH remains the most widely used agent for both VV and VA ECMO. Bolus 50–100 U/kg at cannulation, then weight-based drip to ACT 180–220 s, aPTT 50–75 s, or anti-Xa 0.3–0.7 IU/mL. Caveats: AT-III dependent (acquired deficiency is common on ECMO and masquerades as heparin resistance — check the level before escalating dose), HIT risk, and unpredictable PK. ACT correlates poorly with actual heparin concentration (r² ≈ 0.03 between bolus dose and post-bolus ACT) — use anti-Xa as an adjunct when available.
HIT confirmed or strongly suspected
Bivalirudin is first line. Bolus 0.5 mg/kg IV → infusion 0.15–0.3 mg/kg/h. Target aPTT 50–80 s or ACT 160–220 s. Half-life ~25 min with predominantly enzymatic proteolysis (~80% non-renal), so it offsets fast even without a reversal agent. Reduce infusion ~50% with concurrent CRRT.
Argatroban is the fallback if bivalirudin is not immediately available — no bolus, infusion 0.3–0.5 mcg/kg/min, aPTT 50–80 s. Important: argatroban is not pharmacologically equivalent to bivalirudin in this context (see below).
Emergent cannulation, both DTIs unavailable
If cannulation cannot be deferred — imminent hypoxemic arrest, no DTI on the shelf — a single reduced-dose heparin bolus (~2,500 U IV) for circuit initiation only is defensible. Heparin must be scrupulously avoided before and after the procedural window. Transition to argatroban or bivalirudin immediately post-cannulation. The ACCP guidelines support short procedural heparin re-exposure in HIT when the alternative is death. The institutional fix is upstream: keep both DTIs stocked and bedside-accessible.
Why Bivalirudin Beats Argatroban
The 2023 Chen et al. network meta-analysis (23 trials, 2,522 patients) is the cleanest head-to-head comparison available:
| Outcome | Bival vs UFH | Argatroban vs UFH |
|---|---|---|
| Device thrombosis | ↓ OR 0.51 ✓ | No difference |
| Patient thrombosis | ↓ OR 0.44 ✓ | No difference |
| Major bleeding | No difference | No difference |
| Mortality | No difference | No difference |
Bivalirudin vs argatroban head-to-head for device thrombosis: OR 0.14 (95% CI 0.03–0.51) favoring bivalirudin. The 2025 Hu et al. meta-analysis confirms the signal — lower mortality (OR 0.74), lower thrombotic events (OR 0.52), higher decannulation success (OR 1.87) vs UFH. Bivalirudin is no longer just an "alternative" — it is increasingly the preferred agent in centers with experience.
Argatroban: Dose Depends on the Indication
One of the most common errors is applying the FDA-label HIT dose to ECMO patients. They are not the same regimen.
| Indication | Bolus | Infusion | Target |
|---|---|---|---|
| ECMO (off-label) | none | 0.3–0.5 mcg/kg/min | aPTT 50–80 / ACT 180–220 |
| HIT, FDA label | none | 2 mcg/kg/min (max 10) | aPTT 1.5–3× baseline (≤100) |
| HIT + hepatic impairment | none | 0.5 mcg/kg/min | aPTT 1.5–3× baseline |
| PCI in HIT | 350 mcg/kg over 3–5 min | 25 mcg/kg/min (max 40) | ACT 300–450 |
| Post-PCI continued | none | 2 mcg/kg/min | aPTT-guided |
Half-life ~40–50 min. Avoid in PCI patients with AST/ALT ≥3× ULN. Mayerhöfer et al. (2024) found argatroban guided by hemoclot™ targets (0.4–0.6 µg/mL) may prolong thromboembolism-free time vs anti-Xa guided UFH in VV ECMO — but this is a monitoring strategy, not a thrombosis-reduction signal vs UFH.
Weight Basis and Dose Caps
All three agents are dosed by actual body weight. There is no published ECMO guideline specifying a maximum absolute heparin bolus. A 200 kg patient receives 10,000–20,000 U per protocol; there is no evidence basis for capping at 10,000 U.
The CPB obesity literature does not transfer cleanly: those patients receive ~300 U/kg targeting ACT >400, where overdosing concerns scale up. ECMO uses ~50–100 U/kg targeting ACT 180–220, so the obesity-related overdose risk is proportionally smaller. Practical move in morbid obesity: start at the low end (50 U/kg ABW), check ACT within minutes, titrate. The bolus is a starting point — individual heparin responsiveness is the dominant variable.
For bivalirudin and argatroban specifically, the published cohorts (Tsu Dager n=135, Elagizi Davis n=121) show no clinically significant outcome differences in obese vs nonobese patients dosed by ABW.
BMI Is Not a Contraindication
EOLIA excluded BMI >45, but that was a trial-specific criterion, not a clinical guideline. The actual outcome data go the other way:
- ELSO registry (Peetermans, n=18,529): BMI ≥35 associated with reduced in-hospital mortality (OR 0.878, p=0.008).
- ECMObesity (Rudym, n=790): obesity (BMI ≥30) associated with lower ICU mortality (OR 0.63, p=0.018).
- Hatton 2025 (ELSO, n=24,796): nonlinear relationship — BMI 40 had 18% lower risk of death vs BMI 25.
Scoping review consensus (Ripoll 2024): obesity by BMI alone should not be an exclusion criterion. Technical considerations remain — larger cannulae (25–31 Fr drainage), ultrasound-guided access mandatory, higher flow requirements, increased renal complications — but these are operational, not absolute contraindications.
Pearls
- Bernhardt AM, et al. ISHLT/HFSA Guideline on Acute Mechanical Circulatory Support. J Card Fail. 2023.
- Guglin M, et al. Venoarterial ECMO for Adults: JACC Scientific Expert Panel. JACC. 2019.
- Chen J, et al. Anticoagulation Strategies in ECMO: Network Meta-Analysis. Pharmacotherapy. 2023.
- Hu Y, et al. Bivalirudin Anticoagulation in Adult ECMO: SR/Meta-Analysis. Medicine. 2025.
- Lofy T, et al. Bivalirudin vs UFH in ECMO — Single-Center Cohort. Ann Pharmacother. 2026.
- Lanoiselée J, et al. Heparin Dosing in VA ECMO: PK Analysis. Pharmaceutics. 2024.
- Tsu LV, Dager WE. Bivalirudin Dosing in Obese HIT Patients. Pharmacotherapy. 2012.
- Elagizi S, Davis K. Argatroban Dosing in Obesity. Thromb Res. 2018.
- Haas E, et al. Heparin Management During CPB in Obese Patients. Eur J Anaesthesiol. 2016.
- Vienne M, et al. Adjusted Heparin Calculation Model During CPB: RCT. Eur J Anaesthesiol. 2018.
- Peetermans M, et al. BMI and Respiratory ECMO Outcomes: ELSO Registry. Intensive Care Med. 2023.
- Rudym D, et al. ECMObesity Study. AJRCCM. 2023.
- Hatton KW, et al. BMI and Mortality in VV ECMO. Crit Care Med. 2025.
- Ripoll JG, et al. Obesity as Exclusion Criterion for ECMO: Scoping Review. Anesth Analg. 2024.
- Argatroban (Acova/argatroban) prescribing information, FDA.
The 1980s Should Be Revisited But Not Relived!
The Case Against Treating PVCs in Cardiogenic Shock We have thirty-five years of evidence telling us antiarrhythmics kill patients with ventricular ectopy in diseased hearts. The question is whether we are willing to listen.
By Dr. Jesse Shriki
The Story of a Revolutionary Treatment
Imagine it's 1750. You have a patient with debilitating gout. A colleague hands you a vial of Saturn's Sugar and tells you he's run an impressive trial. Fifty patients, gout attacks down 60%, statistically significant, p less than 0.05. Revolutionary.
You prescribe it. The gout improves. Then your patients start dying of renal failure, encephalopathy, and abdominal crisis. Then you realize Saturns Sugar is lead acetate.
Now imagine it's 1985. You are in the CVICU and your patient has PVCs after a myocardial infarction. You have encainide and flecainide — drugs you've watched terminate life-threatening ventricular tachycardia and fibrillation. They work. You've seen it. The logic writes itself: if these drugs suppress VT and VF, why wouldn't they suppress PVCs? If they work for the dangerous rhythm, surely they work for the benign one. The mechanism is the same. The drug is the same. You prescribe it.
The PVCs disappear.
Then your patients start dying.
Now it's 1990 and the CAST trial comes out. It showed that patients receiving antiarrhythmic therapy had twice the mortality of those receiving placebo — and the trial was stopped early for harm. The PVCs vanished but the patients died anyway — because the PVCs were never the problem. They were a symptom of an injured, electrically unstable myocardium. And giving a sodium channel blocker to that substrate didn't treat the heart. It destabilized it.
The logic that felt unassailable in 1985 — if it works for VT, it works for PVCs — was the same logic as Saturn's Sugar. Treat the marker. Miss the substrate. Bury the patient.
The Evidence
CAST (1989) — The Trial That Should Have Ended This Conversation
The premise of the Cardiac Arrhythmia Suppression Trial was reasonable by the standards of the time. Patients who survived myocardial infarction with frequent PVCs had worse outcomes than those without them. PVCs were a known marker of electrical instability. Antiarrhythmic drugs suppressed PVCs. Therefore — suppress the PVCs, improve survival.
CAST enrolled 1,727 post-MI patients with asymptomatic or mildly symptomatic PVCs and randomized them to encainide, flecainide, moricizine, or placebo. It is worth pausing on who these patients actually were — not critically ill patients in cardiogenic shock, but stable outpatients with asymptomatic ectopy, ambulatory and functional enough to enroll in a trial. If these drugs killed patients that well, the implications for someone already dying of pump failure should be self-evident.
The primary endpoint was arrhythmic death. The drugs worked perfectly as designed — PVC burden fell dramatically in the treatment arms.
The trial was stopped early by the Data Safety Monitoring Board because patients in the encainide and flecainide arms were dying at twice the rate of placebo. Antiarrhythmic therapy significantly increased the relative risk of death or cardiac arrest due to arrhythmia at 2.64 times that of placebo, with a number needed to harm of approximately 29. The drugs killed stable ambulatory patients. They did not need to be sick for these drugs to kill them — they just needed a scarred heart.
The mechanism, reconstructed after the fact, was exactly what we should have anticipated. Encainide and flecainide are sodium channel blockers — Vaughan-Williams Class IC agents. A post-infarction myocardium is scarred, heterogeneously conducting, and electrically vulnerable. Sodium channel blockade in that substrate slows conduction further, widens reentry circuits, and creates the conditions for sustained ventricular tachycardia and fibrillation. The drug that suppressed the PVC created the environment for the lethal arrhythmia.
The PVCs were not the disease. They were a warning light. CAST didn't just turn off the warning light — it cut the brake line.
There is one additional detail from CAST that belongs in every discussion of this topic. There was also an increase in nonarrhythmic death due to MI complicated by cardiogenic shock in the treatment arms compared to placebo. The drugs were not only proarrhythmic. They were negatively inotropic on an already failing myocardium. In a patient already in cardiogenic shock, this is not a theoretical concern. It is a documented cause of death in the very trial your colleagues are dismissing as outdated.
"But Lidocaine Is Different" — Addressing the Obvious Objection
At this point a reasonable clinician might raise their hand and say: you're comparing lidocaine to Class IC agents, but lidocaine is Class IB. Different receptor kinetics, faster dissociation, less use-dependent block. Isn't applying CAST to lidocaine the same logical error you're criticizing?
It's a fair question and it deserves a direct answer.
Lidocaine and the CAST drugs share the same fundamental mechanism: sodium channel blockade on diseased myocardium. The kinetic differences matter in electrophysiology labs and for understanding why lidocaine has a marginally better acute safety profile in some contexts — but they do not change the core problem. You are still applying a drug that alters conduction in an already dysfunctional electrical substrate, for a surrogate endpoint — PVC suppression — that CAST proved does not translate to survival benefit and may cause harm.
More critically: lidocaine has never been shown in any randomized trial to improve outcomes when used for PVC suppression in ischemic or failing myocardium. Not once. The absence of a CAST-equivalent trial for lidocaine is not evidence of safety. It is evidence that after CAST, no ethics board was going to approve randomizing patients to antiarrhythmic therapy for benign ectopy suppression. The question was considered answered.
The argument that lidocaine is safe because it wasn't the drug in CAST is like arguing Saturn's Sugar is safe because the trial used a different lead compound. The substrate hasn't changed. The mechanism of harm hasn't changed. The burden of proof falls on demonstrating safety — and that evidence does not exist.
ROC-ALPS (2016) — The Best Antiarrhythmic Trial Ever Done, and What It Actually Showed
If CAST told us antiarrhythmics harm patients with benign ectopy, ROC-ALPS told us something equally uncomfortable: even in the most favorable possible scenario for these drugs — sustained, shock-refractory VF and pVT during active cardiac arrest — the survival benefit is marginal at best and statistically undetectable at worst.
ROC-ALPS was a randomized, double-blind, placebo-controlled trial enrolling 3,026 adults with out-of-hospital cardiac arrest due to shock-refractory ventricular fibrillation or pulseless VT across ten North American sites. This was the ideal population for antiarrhythmic therapy — active malignant arrhythmia, ongoing resuscitation, the highest-stakes scenario imaginable. Patients received amiodarone, lidocaine, or saline placebo.
Neither amiodarone nor lidocaine demonstrated a statistically significant difference in survival to hospital discharge or favorable neurological outcome compared to placebo. Both drugs improved rates of return of spontaneous circulation slightly — the arrhythmia responded — but that intermediate win evaporated by the time patients reached discharge. The survival signal was gone.
There was one subgroup where a modest signal emerged: bystander-witnessed arrests where CPR was initiated immediately. In that narrow population, both drugs showed some benefit. The interpretation is physiologically coherent — if you reach the patient in the electrical phase of arrest, before metabolic collapse, antiarrhythmics may have a brief window of effect. Once the myocardium is ischemic and acidotic, that window closes.
Now consider what this means for your ICU patient with PVCs in cardiogenic shock. ROC-ALPS tested amiodarone and lidocaine in active cardiac arrest — the strongest possible indication, the highest possible arrhythmic burden, the scenario where these drugs have the most theoretical justification. And the survival benefit was statistically undetectable. If the drugs barely move the needle in pulseless VT and VF, what is the biological rationale for expecting them to improve outcomes in a perfusing patient whose PVCs are a downstream symptom of hemodynamic failure?
There isn't one.
Antiarrhythmics Are Appropriate Sometimes!
This piece is not an argument against antiarrhythmics in every context. It is an argument against their use as a reflexive response to ectopy in a patient who is already perfusing. That boundary matters and it needs to be stated explicitly, because the strawman version of this argument — so you'd never treat VT storm? You'd never give amiodarone for sustained hemodynamically unstable VT? — is not what the evidence supports and not what is being argued here.
The clinical line is this: if your patient is in sustained ventricular tachycardia or fibrillation with hemodynamic collapse, you cardiovert. If the arrhythmia recurs and the patient cannot be stabilized electrically, antiarrhythmics have a role as a bridge — amiodarone for refractory VT storm, lidocaine as a reasonable alternative, with full recognition that even here the mortality evidence is weak and the primary intervention is always electricity, not pharmacology.
What the evidence does not support — what CAST, SWORD, CASH, CAST II, and ROC-ALPS collectively and consistently tell us — is using these drugs to suppress PVCs or non-sustained VT in a patient who is hemodynamically stable or whose ectopy is clearly driven by the underlying shock physiology. That patient does not need their sodium channels blocked. They need their ischemia treated, their electrolytes corrected, their acidosis addressed, and their hemodynamics optimized. The arrhythmia is a symptom. Treat the disease.
The distinction is not subtle once you see it. Sustained VT with a pressure of 60 is a primary electrical emergency. PVCs in a patient on two pressors with a lactate of 6 is a sick heart telling you it is sick. One calls for intervention. The other calls for restraint — and restraint, in a culture that rewards action, is the harder skill.
The Antiarrhythmic Graveyard — CAST Was Not Alone
CAST did not occur in isolation. It was the loudest alarm in a pattern the field kept repeating for another decade, each time with a different drug, the same surrogate endpoint logic, and the same result.
CAST II (1992). After CAST I stopped encainide and flecainide, moricizine — now you know why you have never heard of it — was spun off into its own trial. The reasoning was that moricizine had a different profile and might yet prove beneficial. CAST II was also stopped early when treatment with moricizine was associated with increased cardiac death and long-term benefit seemed highly unlikely. Three drugs. Three arms. All stopped for harm. The field had now run the same experiment three times in sequence and gotten the same answer each time.
SWORD (1996). SWORD tested d-sotalol — a Class III potassium channel blocker, mechanistically distinct from the Class IC agents in CAST — in post-MI patients with reduced ejection fraction. Different drug class, same hypothesis: suppress the arrhythmic substrate, improve survival. SWORD found excess mortality with d-sotalol compared to placebo in patients with left ventricular dysfunction after myocardial infarction. The trial was stopped early. The pattern held across drug classes.
CASH (1994). The Cardiac Arrest Study Hamburg compared propafenone against ICD therapy in survivors of cardiac arrest. These were not PVC suppression patients — these were people who had already survived a lethal arrhythmia, the most justified antiarrhythmic indication imaginable. Survivors of cardiac arrest treated with propafenone had increased mortality compared with those treated with an implantable cardioverter defibrillator. Even in secondary prevention after survived arrest, a sodium channel blocker on diseased myocardium killed people faster than a device that simply waited for the arrhythmia and terminated it.
PALLAS (2011). Dronedarone — marketed as a safer amiodarone alternative — was tested in patients with permanent atrial fibrillation. Dronedarone showed increased rates of stroke, heart failure hospitalization, and cardiovascular death. The trial was stopped. Another drug, another surrogate-driven rationale, another harm signal.
What these trials share is not a drug class or a mechanism. What they share is the logical architecture: identify an arrhythmic marker, find a drug that suppresses it, assume suppression equals benefit, skip to clinical adoption. Every single time this reasoning was tested rigorously in a diseased myocardium, it was wrong.
It has been estimated that more Americans were killed by Class IC antiarrhythmics than died in the Vietnam War — not from recklessness, but from a rational-seeming clinical framework that was never stress-tested against hard outcomes until CAST forced the issue.
Old Evidence Is Not Weak Evidence
At this point the defense of bedside antiarrhythmic use usually retreats to its well meaning but last resort position: these are old trials, medicine has moved on, we have better drugs now.
This argument has the epistemology exactly backwards.
There is an asymmetry in how we should weight trial results that most clinicians were never explicitly taught. In 2005, Stanford epidemiologist John Ioannidis published what became one of the most cited papers — at least by me — in the history of medicine: Why Most Published Research Findings Are False. He demonstrated mathematically that the majority of positive findings in biomedical literature do not replicate. The reasons are familiar to anyone who reads critically: small sample sizes, low prior probability, publication bias that buries negative results, and underpowered trials fishing for signal.
The implication is profound and underappreciated at the bedside: when a trial shows benefit, be skeptical. When a trial shows harm and is stopped early, believe it.
Trials stopped for harm are stopped precisely because the signal is unambiguous. The Data Safety Monitoring Board does not pull the plug on CAST because of a trend. They pull it because patients are dying at twice the rate and continuing the trial would be unethical. That is not a weak signal corrupted by time. That is the strongest possible signal the clinical trial apparatus can generate — a result so clear that continuing randomization became indefensible.
CAST is not old evidence. It is mature evidence. It has had thirty-five years to be contradicted and has not been. SWORD confirmed it in a different drug class. CASH confirmed it in a different population. CAST II confirmed it with a third drug in the same population. The graveyard of antiarrhythmic trials is not a historical curiosity — it is a convergent body of evidence pointing in one direction with extraordinary consistency.
Compare this to the drugs your colleagues are confidently reaching for. What is the RCT evidence that lidocaine improves outcomes when used for PVC suppression in cardiogenic shock? There is none. Not old evidence, not weak evidence — no evidence at all. Under Ioannidis's framework, the prior probability that an antiarrhythmic drug suppressing a surrogate endpoint in a diseased myocardium will improve survival is not just low — the existing literature has repeatedly tested that hypothesis and found it causes harm. The prior is negative.
We do not demand a new randomized trial before accepting that lead is toxic. We do not require a 2026 placebo-controlled study of cefazolin surgical prophylaxis because the 1969 evidence is dated. In both cases the mechanism is understood, the harm or benefit is established, and repeating the experiment on human subjects would be unethical precisely because we already know the answer.
The same logic applies here. CAST told us what antiarrhythmics do to ectopy in a sick heart. The answer was not what anyone expected, which is exactly why we should trust it. Unexpected harm signals that terminate trials early are the most reliable findings in all of clinical research — because unlike positive findings, they have no publication bias working in their favor. Nobody was hoping patients would die faster. The result was forced on the investigators by the data.
When anyone says CAST is old, the correct response is: you are right that it is old. It is old because no one has been willing to repeat it. And no one has been willing to repeat it because randomizing patients to treatments with established lethal signals is a violation of research ethics, not a gap in the literature.
The absence of a modern trial is not a reason to act. It is the reason to stop.
"Don't just do something — stand there"
PVCs in cardiogenic shock are not a primary electrical disease. They are a downstream manifestation of ischemia, elevated wall stress, catecholamine surge, electrolyte derangement, and acidosis. The treatment algorithm is therefore not pharmacologic suppression — it is hemodynamic correction. Address the ischemia, correct the electrolytes and the acidosis, optimize preload and afterload. Consider mechanical circulatory support if the hemodynamics demand it. If the patient develops sustained VT or VF with hemodynamic collapse, cardiovert — and then ask why the myocardium generated that arrhythmia in the first place.
If the patient has PVCs and is hemodynamically stable: do nothing. Watch. Treat the cause.
The hardest skill in critical care isn't knowing what to do. It's knowing when to do nothing. "Don't just do something — stand there" is not passivity. In this context, it is the evidence-based choice. It takes years of specialty training to sit on your hands at the bedside while a monitor alarms and a nurse looks at you expectantly — and to know with confidence that the most dangerous thing you can do is reach for the drug.
The PVCs are a smoke alarm. Removing the battery does not put out the fire. In cardiogenic shock, if the data are any guide, it may make the fire worse.
Saturn's Sugar improved the gout. The patients still died. Thirty-five years of antiarrhythmic trials have told us the same story in the language of randomized controlled evidence. The 1980s gave us the question. The evidence answered it. We should stop pretending otherwise.
Are we correcting sodium too slowly — and is it killing patients?
It All Begins Here
by Dr. J. Shriki
Dustin G. Mark, Mubarika Alavi, Joshua R. Nugent, et al.Sodium Correction Rates and Associated Outcomes Among Patients With Severe Hyponatremia: A Retrospective Cohort Study. Ann Intern Med.2026;179:330-339. [Epub 27 January 2026]. doi:10.7326/ANNALS-25-03676
A deep dive into a landmark Annals paper on hyponatremia correction rates, the methods behind it, and what it means for critical care practice.
Good day, Eh!, and Welcome to my first blog post on the Meducation website reboot. I wanted to kick things off with a paper that I think perfectly embodies what this site is about. It challenges entrenched dogma — specifically the US approach to sodium correction, which, as we'll see, the Europeans have quietly been doing better for years. It uses rigorous, thoughtful methodology to squeeze real signal out of a dataset that, while large in clinical terms, is modest by the standards of modern big data. And it covers a condition we deal with constantly in the cardiac ICU.
The paper is Sodium Correction Rates and Associated Outcomes Among Patients With Severe Hyponatremia by Mark et al., published in Annals of Internal Medicine in January 2026 — fresh off the press. Let's get into it.
Background: the dogma we inherited
Severe hyponatremia — defined as serum sodium at or below 120 mEq/L — affects roughly 1% of hospitalized patients and carries substantial morbidity and mortality. For decades the clinical response has been governed by one overriding fear: osmotic demyelination syndrome (ODS), previously called central pontine myelinolysis. The mental image is vivid: correct sodium too fast, osmotic stress tears apart the myelin sheath, and you've traded a fixable electrolyte problem for a permanent neurologic catastrophe.
That fear has been productive in some ways — it prompted systematic thinking about correction rates. But it's also driven guidelines toward targets that may be dangerously conservative. The American guidelines in particular have recommended correction as slow as 4–6 mEq/L per 24 hours. The problem is a growing body of evidence suggesting that slow correction isn't neutral — it's independently associated with higher mortality. Patients who are persistently hyponatremic are suffering ongoing hyponatremic encephalopathy, aspiration events, and prolonged critical illness. We've been so afraid of the rare catastrophe of ODS (incidence 0.2–0.5%) that we may have been causing net harm to the majority.
The core tension: ODS is devastating but rare. Persistent hyponatremia is common and also deadly. Guidelines optimized to prevent the former may be increasing the latter — and this paper is the largest observational evidence yet that this is exactly what's happening.
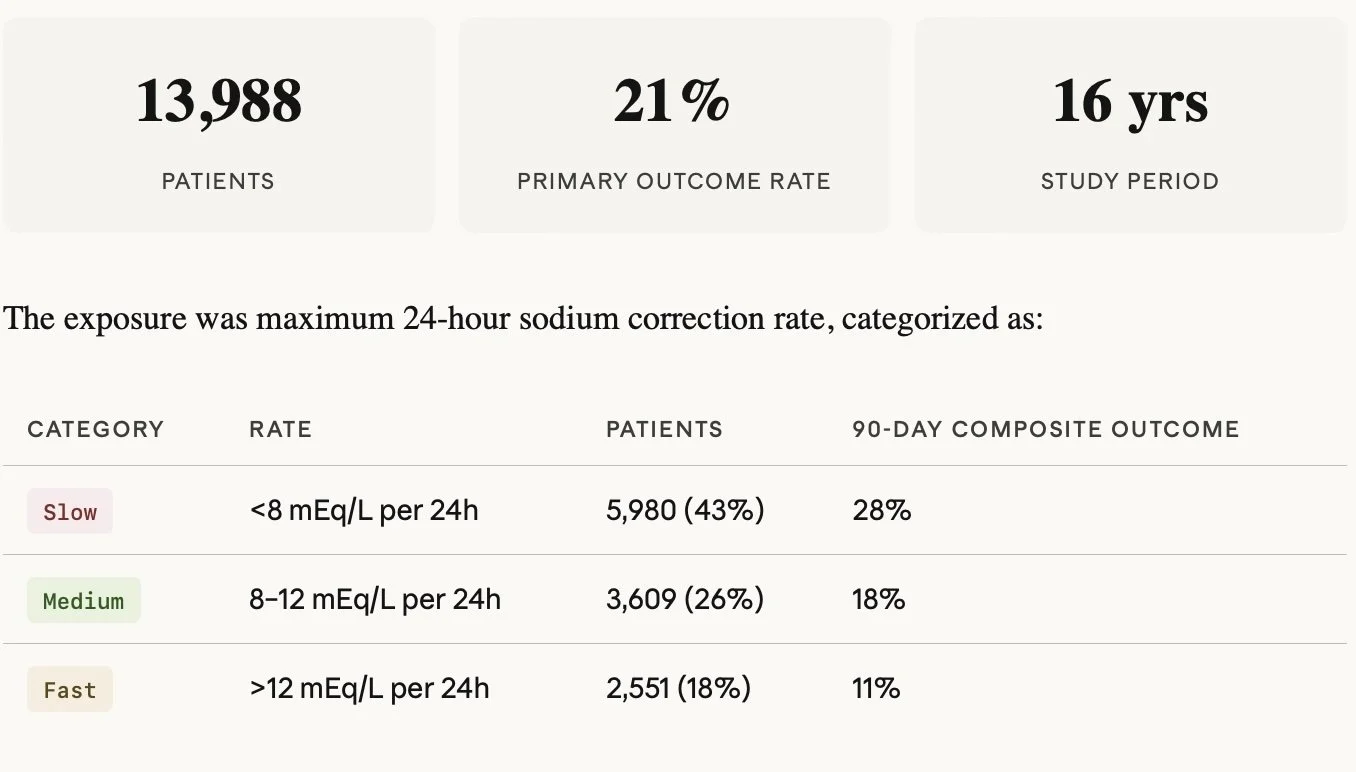
The study: what they did
This is a retrospective cohort study from Kaiser Permanente Northern California — 21 community hospitals, 16 years of data (2008–2023). The cohort is adults admitted from the ED with sodium at or below 120 mEq/L, with the first qualifying admission per patient used. After exclusions for dilutional hyponatremia (glucose ≥400) and lack of continuous health plan coverage, they ended up with just under 14,000 patients for the 90-day outcome analysis.
The primary outcome was a composite of 90-day death or delayed neurologic events — importantly, the neurologic endpoint was deliberately broad, capturing demyelinating disease, paralytic syndromes, epilepsy, and coma/altered consciousness occurring between day 3 and day 90. This was smart design: ODS alone is underdiagnosed and heavily subject to confirmation bias (you're more likely to call a radiographic lesion ODS if you know the patient overcorrected). Broadening the net reduces that bias.
The methods: why this is worth taking seriously
Let’s take a second to remember how to read primary literature. Never Read the intro, discussion or conclusion! First read the title, then maybe the abstract, then always START with the methods section. Then read the results section, more importantly look at the tables and numbers not the words. Now the important part… GENERATE YOUR OWN CONCLUSIONS!!! Now you are ready to read the intro and conclusions sections. When you do that you will start to see the methods section of this paper is where the paper earns its credibility. They used targeted maximum likelihood estimation (TMLE) as their primary estimator — a doubly robust, semiparametric approach that I think is genuinely the right tool for this kind of causal inference problem in observational data. Let me explain what that means in practice.
TMLE — THE PRIMARY ESTIMATOR
TMLE uses two models: an outcome model predicting the probability of death or neurologic events given treatment and covariates, and a propensity model predicting the probability of each correction rate category given covariates. In other words it makes two different regression equations as a way to compare internal validity of the paper. The key is the targeting step — it uses the propensity scores to compute a correction term that updates the outcome model specifically to reduce bias for the estimand you care about (here, the standardized risk difference). The final estimate comes from marginal standardization over updated predictions — effectively asking what the outcome rate would be if the entire population received slow versus fast correction, holding covariates fixed.
The doubly robust property means you only need one of the two models to be correctly specified for the estimate to be consistent. That's a meaningful protection in complex real-world data where you can't be certain either model is perfect.
SENSITIVITY ESTIMATORS — AIPW AND IPWRA
Augmented Inverse Probability Weighting (AIPW)
Starts with an IPW estimator (reweighted observed outcomes using propensity scores) and adds an augmentation term derived from outcome model residuals that corrects for propensity model imperfection. Doubly robust — consistent if either model is correct.
Inverse Probability Weighted Regression Adjustment (IPWRA)
Fits weighted outcome regression models within a propensity-score reweighted pseudo-population, then marginalizes. Also doubly robust. Slightly less efficient than TMLE in finite samples but conceptually complementary.
The fact that all three estimators agreed is important. It means the result isn't an artifact of any single modeling choice. That convergence across independent methodological pathways substantially increases confidence in the direction of the finding.
E-VALUES — QUANTIFYING RESIDUAL CONFOUNDING
The E-value answers a specific question: how strong would an unmeasured confounder need to be — simultaneously on both the exposure-confounder and confounder-outcome axes — to fully explain away the observed association?
Weak: 1.0–1.5
Modest: 1.5–2.0
This paper: 2.3–2.7
Strong: 3.0–4.0
Almost impossible: >4.0
An E-value of 2.3–2.7 is in the moderate range — not dismissible but not airtight. The honest concern is that the most plausible unmeasured confounder here — the pathophysiology driving hyponatremia — may operate near exactly this magnitude. A patient with volume-depleted thiazide hyponatremia or beer potomania will correct fast naturally and has low baseline mortality. The LAPS and Elixhauser adjustments capture chronic comorbidity and admission physiology but can't fully disentangle why sodium is low or why it's rising. It's plausible residual confounding in the 2–3x range exists, which is precisely why this finding is suggestive but not causal proof.
The results: what they found
Relative to slow correction, both medium and fast rates were associated with meaningfully lower adjusted risk for the primary composite outcome.
Fast versus slow had a standardized risk difference of −9.0 percentage points (95% CI −11.1 to −6.9).
Medium versus slow was −5.6 percentage points (−7.1 to −4.0).
These are clinically large numbers in a population with an 18% 90-day mortality rate.
The heterogeneity analysis was one of the more interesting features. They stratified by predicted risk quartile and found that absolute risk differences became more negative (i.e., benefit of faster correction grew larger) as baseline risk increased — but risk ratios remained roughly constant. This is what you'd expect from a real treatment effect rather than a confounding artifact: higher-risk patients have more to gain absolutely from the same relative benefit.
The exploratory U-shape finding: When correction rate was modeled as a continuous variable, predicted risk reached a nadir around 15–20 mEq/L per 24 hours before rising again at higher rates. This aligns with animal data showing ODS risk at rates exceeding 20–25 mEq/L. The U-shape is plausible biology — but the right tail had sparse data and this should be treated as hypothesis-generating only.
The ODS-specific signal was also notable for what it didn't show: only 19 coded cases of demyelinating disease in nearly 14,000 patients. Coma and altered consciousness accounted for 60% of delayed neurologic events — and faster correction was associated with fewer of those events, not more. This is the opposite of what ODS-centric guidelines predict.
Where European guidelines are already ahead
The 2014 ESE/ERA-EDTA European guidelines target approximately 10 mEq/L per 24 hours with a ceiling of 10–12 — which maps almost exactly to the "medium" correction category in this paper. The medium group had significantly better outcomes than the slow group and, critically, did not have worse neurologic outcomes than the slow group. So in a sense, this paper is large-scale retrospective validation that European practice is on the right track, and that the American insistence on 4–6 mEq/L targets for most patients is probably causing net harm. The Europeans have been operating in the medium zone while Americans have been trained to fear it.
The honest limitations
Residual confounding. The pathophysiology of hyponatremia is largely unmeasured. Self-correcting causes inflate the apparent fast-correction benefit. E-values of 2.3–2.7 are moderate, not overwhelming.
ODS-risk subgroup power. The subgroup analyses in high-risk patients (cirrhosis, malnutrition, hypokalemia) were not powered to detect harm from faster correction in that specific population. The absence of a signal is not the same as absence of risk.
ICD-10 outcome ascertainment. Neurologic events captured by diagnostic codes will miss cases and may misclassify others. The authors acknowledge neurologic events missing at random — reasonable but not verifiable.
No preadmission sodium. Chronicity of hyponatremia — a major ODS risk factor — is largely uncaptured. Acute-on-chronic versus purely chronic patterns likely behave very differently.
Observational design. Causation cannot be inferred. The RCT this field needs — randomizing patients to different correction rate targets with appropriate ODS-risk stratification — remains undone.
Bottom line
CLINICAL TAKEAWAY
This paper is not practice-changing on its own. It is observational, residual confounding is a legitimate concern, and the ODS-high-risk subgroup remains genuinely uncertain territory.
What it does do is add substantial weight to a growing body of evidence — including a 2025 JAMA Internal Medicine meta-analysis showing 6–13% absolute mortality increase with slow correction — that the 4–6 mEq/L target is probably causing net harm in most patients. The medium range of 8–12 mEq/L, already endorsed by European guidelines, now has both biologic plausibility and the largest observational cohort yet behind it.
The practical translation: don't panic about medium correction rates, treat hyponatremic encephalopathy aggressively when it's present, and reserve the most conservative targets for the truly high-risk ODS patients — while acknowledging that even that recommendation rests on weak prospective evidence. And recognize that desmopressin for rescue overcorrection remains a critical tool in your back pocket.
What the field ultimately needs is a properly powered RCT with ODS-risk stratification. Until then, this paper is the best data we have — and it points clearly toward loosening the reins.